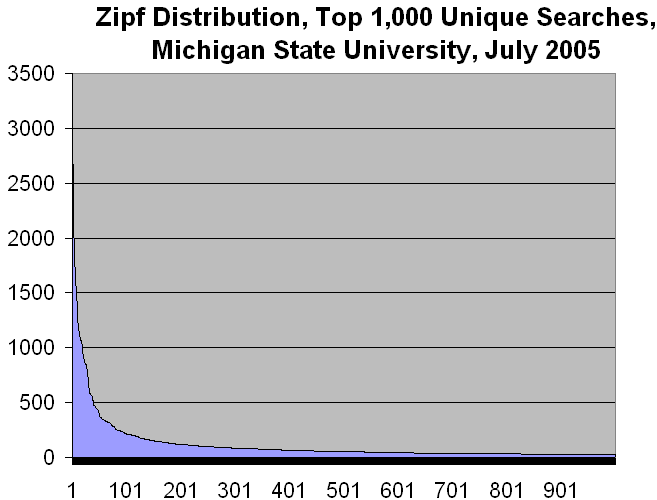
So we're seeing lots of examples of Zipf Curves, which I first came to understand 4 or 5 years ago when doing Web search log analysis. But you've got to define your terms and understand just how long that long tail can be. Consider two graphs:
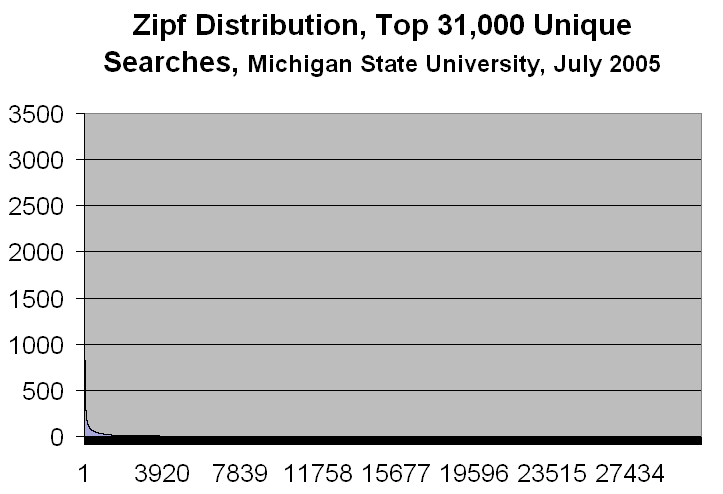
Now look at this one:
(Click to see full-size image.)
Here's the important part: These two charts represent the same data. The first one covers the top 1000 unique searches. The second one covers the top 31,000 unique searches. When you look at all searches in a given period, you discover a large number of unique -- one-off -- search phrases.
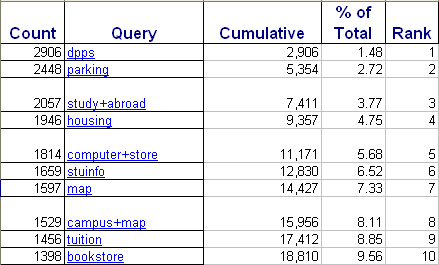
Another way of understanding the curve is to look at how many unique searches are required to reach certain percentiles of coverage. Look at the top 10 unique search phrases at Michigan State:
 (Click to see chart full-size)
This dramatically demonstrates how much the "head" of the curve holds. Now, to understand the rest of the curve, we can examine how far down the curve we have to travel in order to achieve further coverage.
For instance, to cover 20% of all unique searches, we need merely include the top 32 items. To cover the rest of the curve:
Percent Rank
30% 85
40 203
50 441
60 925
70 2182
80 5617
90 13770
100 31000
Suppose, for instance, that we put some effort into providing "Best Bets" for our search engine, ensuring that we direct people to the "best" page for the most popular searches. Based on this sample, we could achieve that for 60% of all searches with a database of only 925 entries.
"The Long Tail" argument goes like this: there's lot to mine in the niches. But for search log analysis and Best Bets, you're a fool if you dedicate resources too far into the tail. You're turning yourself into a research librarian with thousands of customers daily. You can't afford to build a Best Bet for a search that may never be performed again.
I think there's a paradox here. Anderson gives the example of Netflix, which ships DVDs by US Mail. They can afford to keep much deeper inventory than, say, your local Blockbuster. So if you want to rent an obscure documentary, Netflix can make money and you get to see the obscure title you crave.
Anderson argues that retailers who distribute digital content, such as MP3 audio, can really win. Disk is cheap and distribution is practically free.
So here's the paradox: I think the equation is reversed for Web search services. Google is the leading search engine because the PageRank algorithm serves the short head of the curve, and the middle of the curve, so very well. Millions of people find what they seek. But travel too far out on the tail end, and Google will fail you. In fact, if there's only one or two links to your obscure page, Google may drop it right out of the index.
But sometimes you really need some obscure piece of information. You might have a question that you're willing to pay $1000 or $100,000 to have answered. Rather than paying less per unit in the long tail, you might be willing to pay many times more.
Even if you're not willing to pay big bucks, if your query is rare enough that you can't find satisfaction at the short head, if you're motivated enough to find your answer, you may spend real time and/or money to find your answer:
- You ask your reference library to do some research.
- You pay money to search a commercial database.
- You hire an outsider to do the research -- perhaps a freestanding research firm, or perhaps you float your query to Google Answers.
So if your research query ends up being at the end of the long tail, you may pay more per item, not less.
No comments:
Post a Comment